Some Visual Analytics Results for ISWC 2013
In the following we would like to show you some visual analytics results based on data from the International Semantic Web Conference ISWC 2013, citation data from the well known 2001 Semantic Web paper, the 2009 Linked Data -- The Story So Far paper, and Linked Data sets that contain latitude and longitude coordinates (e.g., data about places, people, events). Most data was collected and processed by the STKO lab(*) together with ISWC 2013 metadata from Li Ding that had to be enriched with spatial information. The work shows some examples of scientometric analysis that we are currently doing thanks to IOS Press in the Trends In Science Observatory project. Before we start: If you like the figures, feel free to reuse them in whatever way you like and contact us if you need more details. You can access higher resolution versions either by directly opening the figures or by using the download links in the text.
Places
ISWC 2013 Author Impact
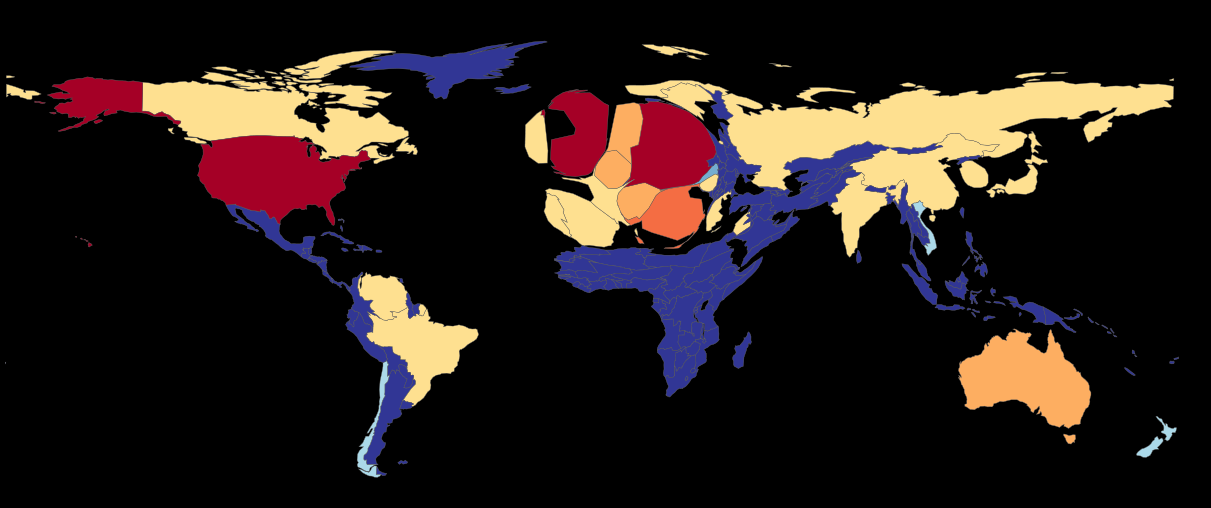
The following cartogram scales the area (and shape) of a country as a function of the impact of authors that are affiliated to institutions in this country. The data is normalized by the population count of the country and authors have different weights based on the number of papers they co-authored. For example, Abraham Bernstein (and his group) is the reasons that you see Switzerland exaggerated. You can also immediately see that Germany, Italy, the UK, Ireland, and a few other countries are key Semantic Web players. This is also the case for the USA, however, based on its area and population the difference is rather small. Other countries and even entire continents are highly underrepresented in terms of ISWC 2013 authorship. If you are searching for a baseline, you may want to check this blog post that shows a cartogram of visitors of the Semantic Web journal.
Centers of Gravity
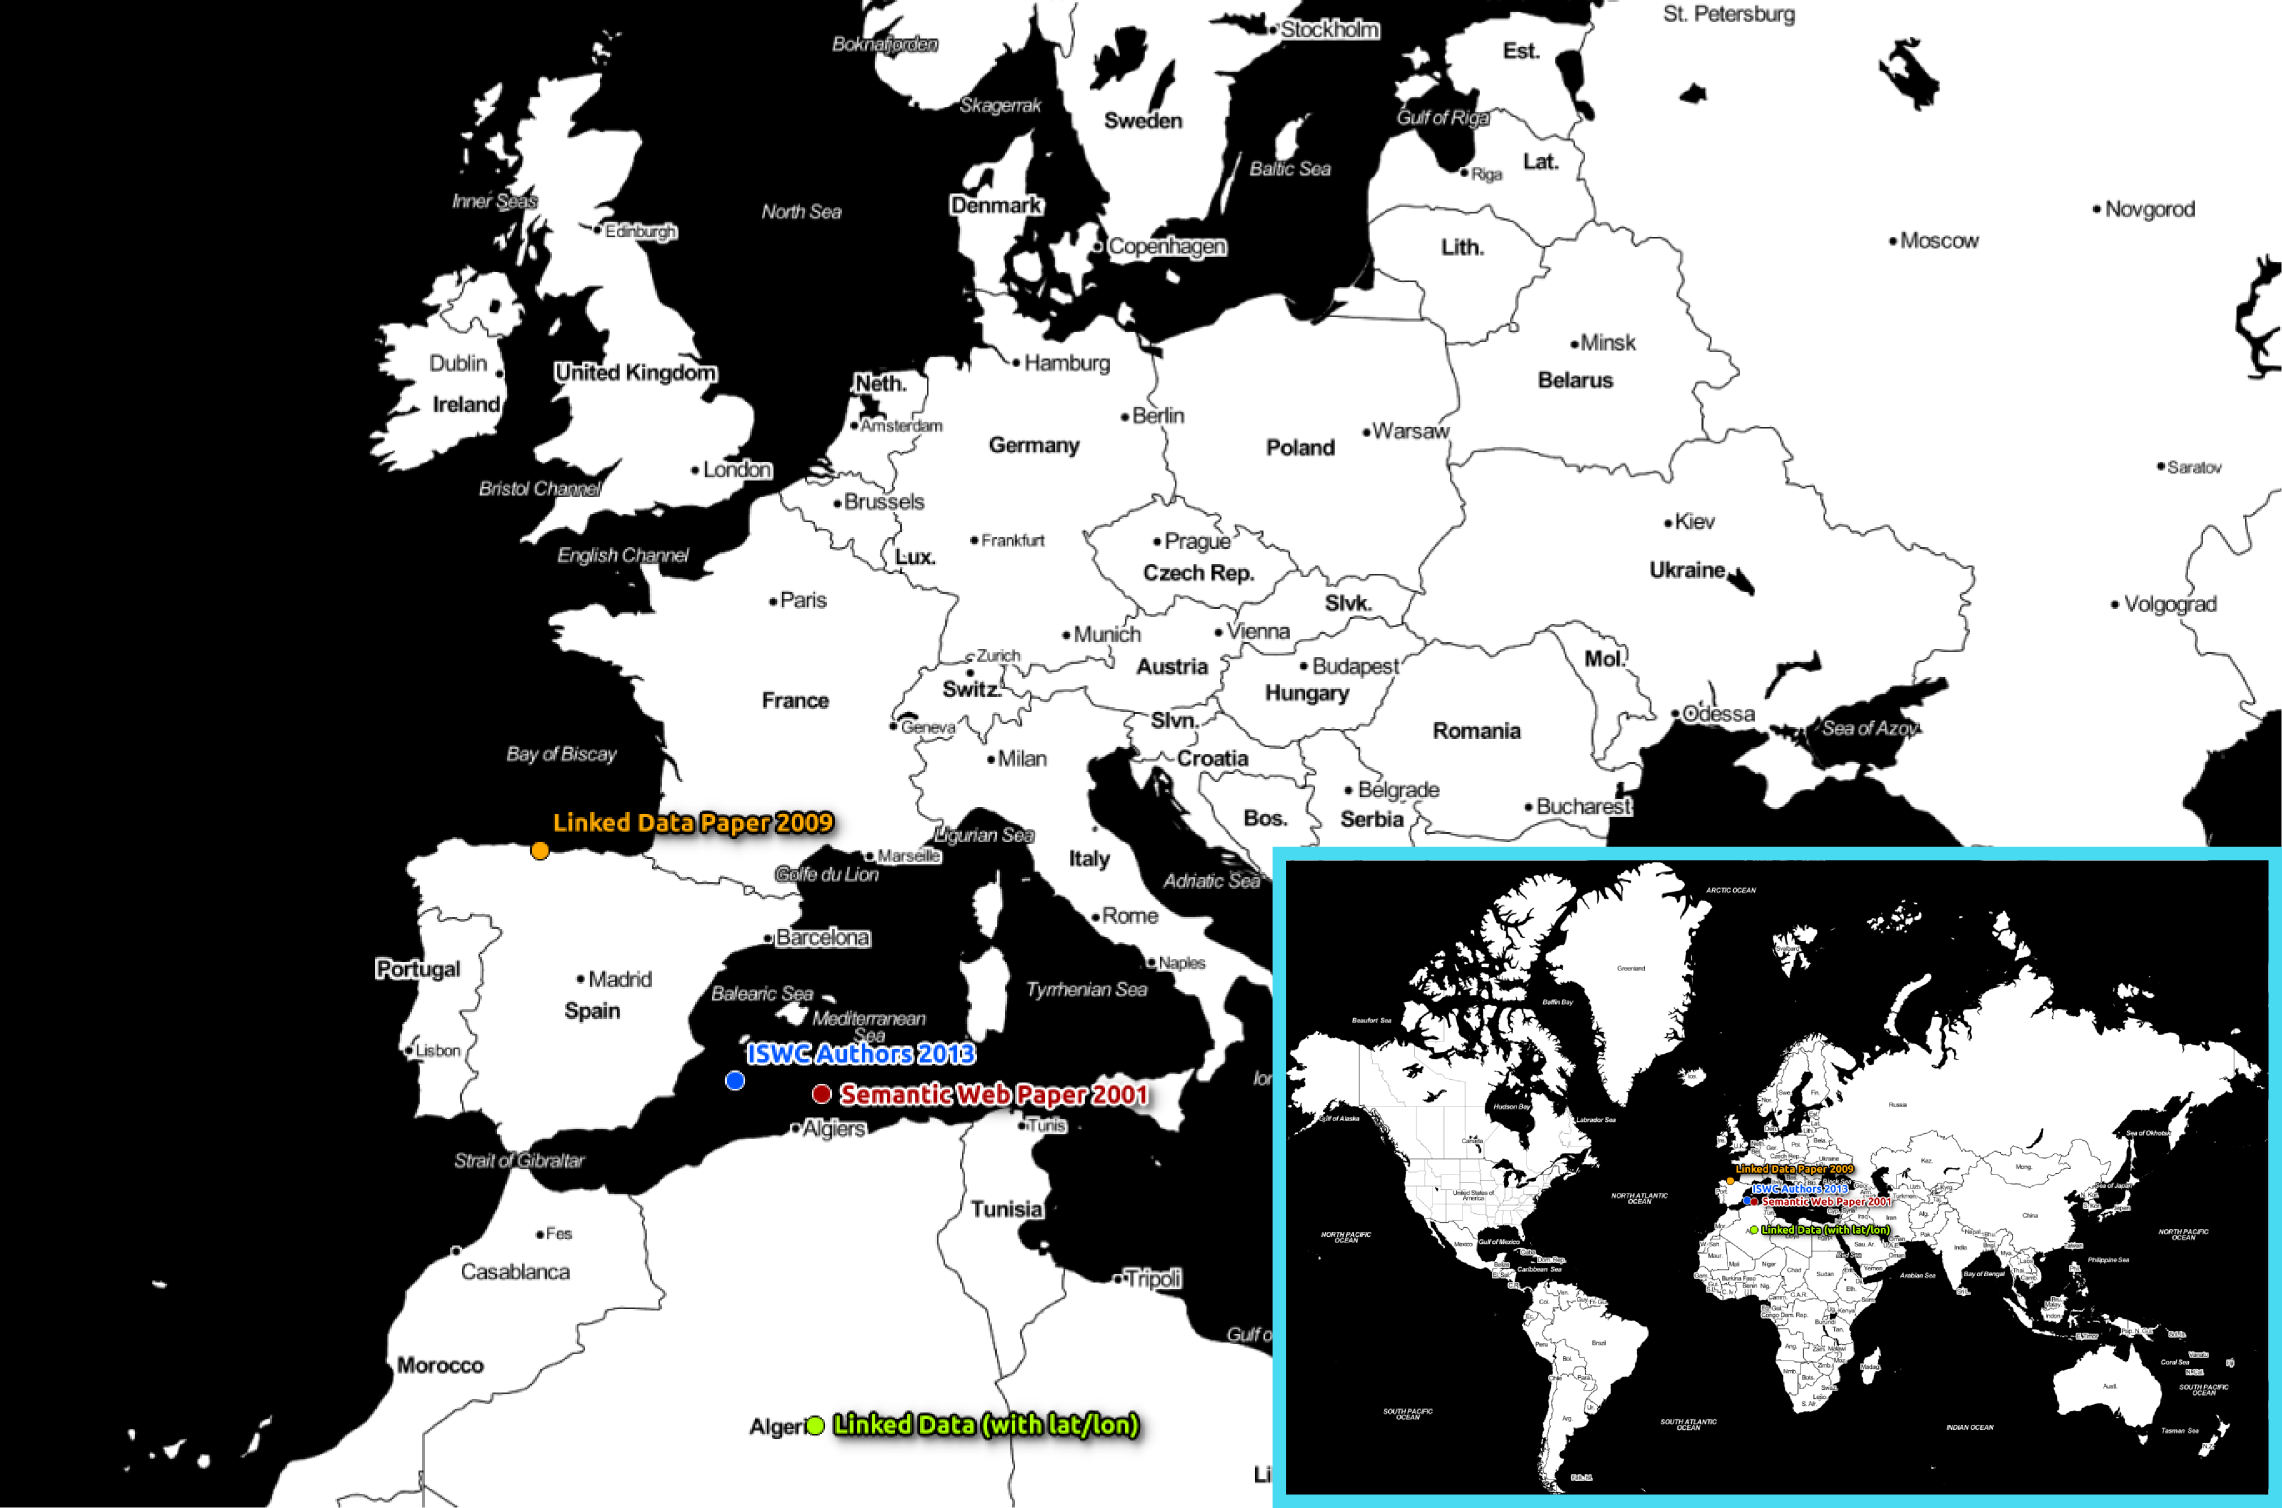
While the cartogram should already give you a first impression, the following map shows the centers of gravity for multiple datasets and thus allows for direct comparisons. It shows the centroids for ISWC 2013 authors, affiliations of authors citing the 2001 Semantic Web paper, affiliations of authors citing the 2009 Linked Data -- The Story So Far paper, as well as the centroid of about 15 million point-like feature representations from the Linked Data cloud as of spring 2013. It contains data about places, people, events, and so forth from major hubs such as Dbpedia, Freebase, Geonames, etc. Of course you cannot compute a meaningful centroid on the surface of a sphere. Thus, the following examples work on projected coordinates. Nonetheless, the resulting centroids will depend on the used projection and centroids are best computed for small areas. In other words, do not try to read more into the next figures than that the majority of Semantic Web research takes place in Europe and most ISWC 2013 authors are based in Europe. As you can see the centroids are relatively close to each other which is a good sign. You can also see that the center of gravity of the LD cloud is more to the South. We cannot discuss details here but this is due to the open data movement in different countries as well as the nearly global (but biased) coverage of data stored in DBPedia and related data sets.
Centroid Trajectory
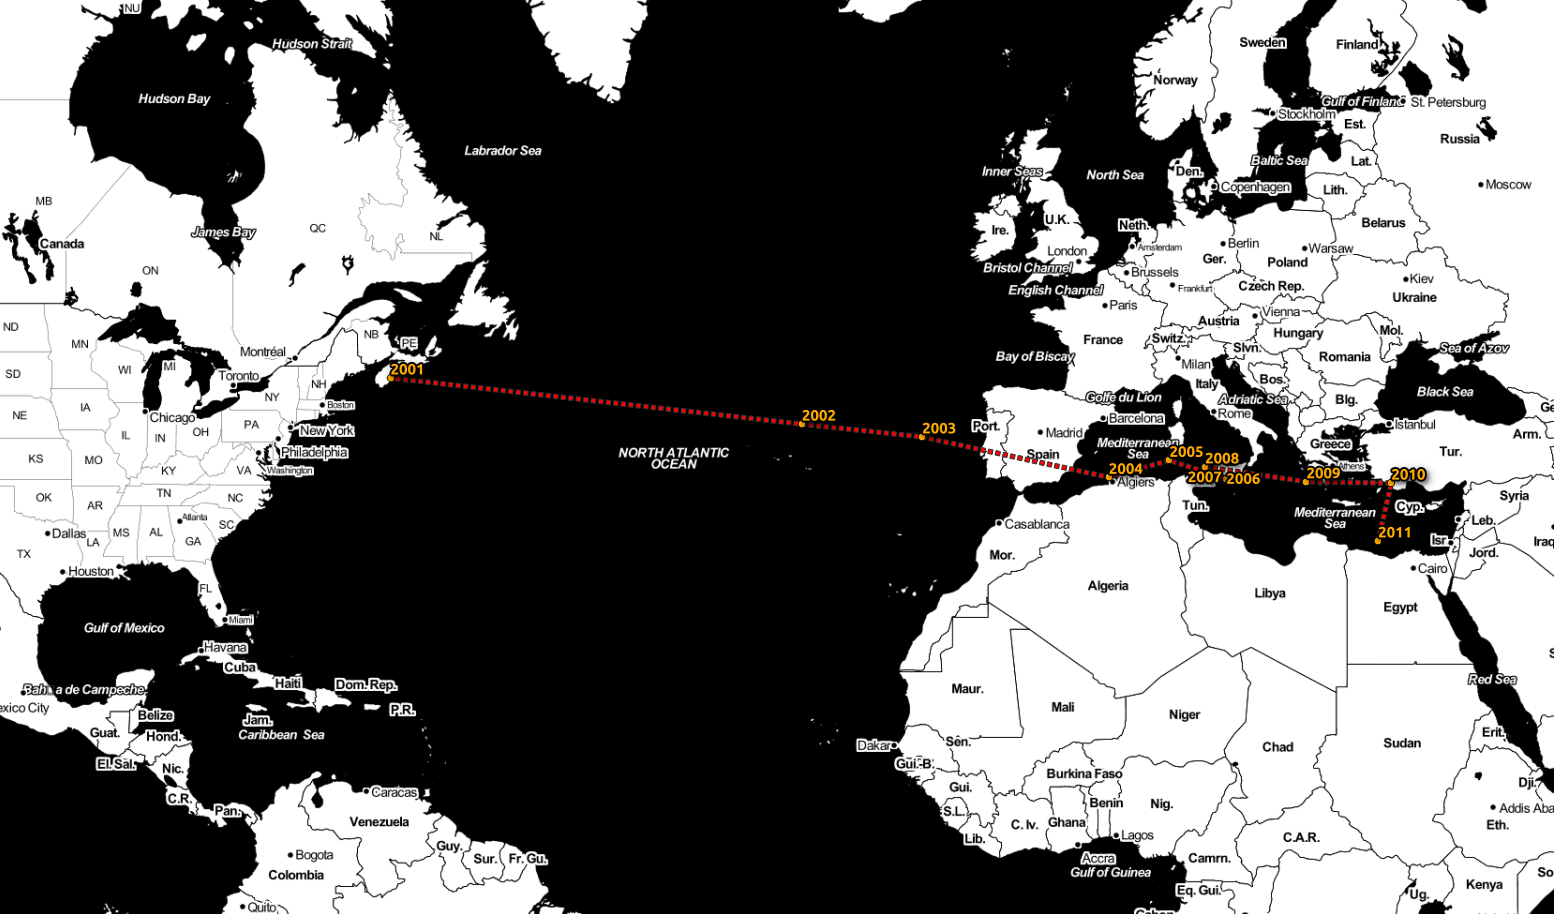
In case you find the maps above to be too atemporal, the rendering below shows the moving center of gravity of author affiliations citing the 2001 Semantic Web papers during 10 years (i.e., from 2001 – 2011). The underlying data is based on about 3000 citations (roughly 200-350 per year).
People and Places
Collaborations
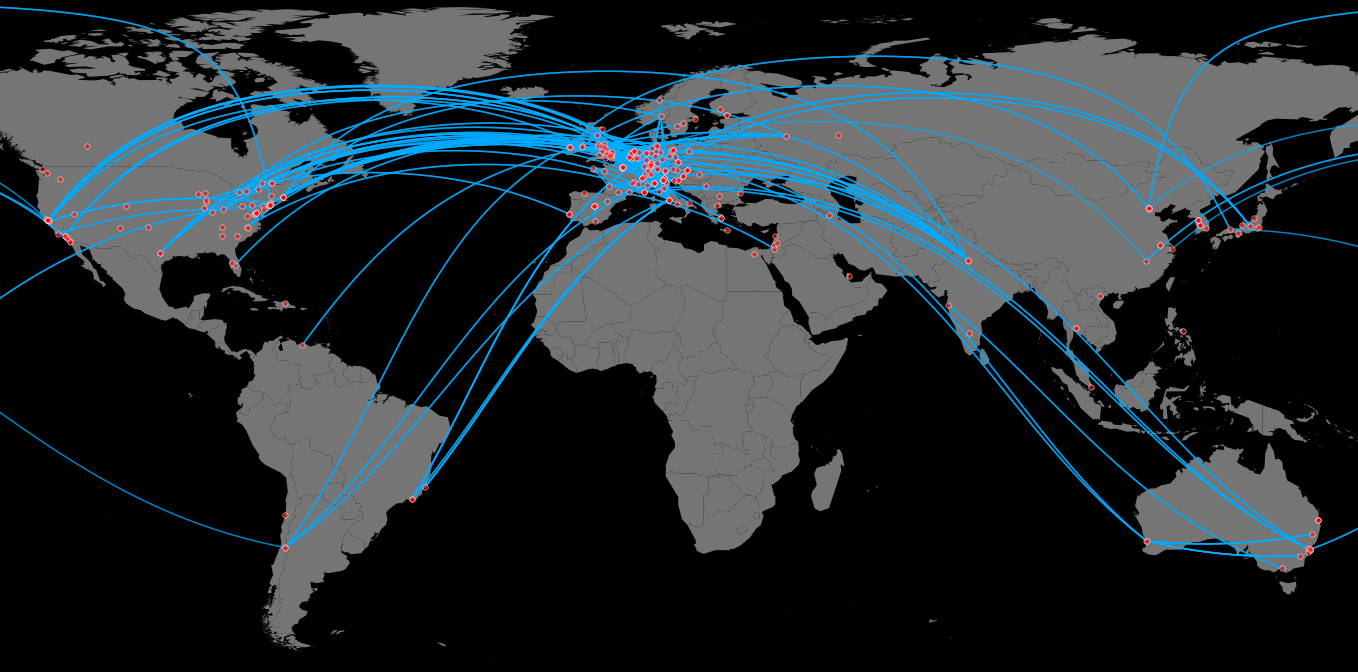
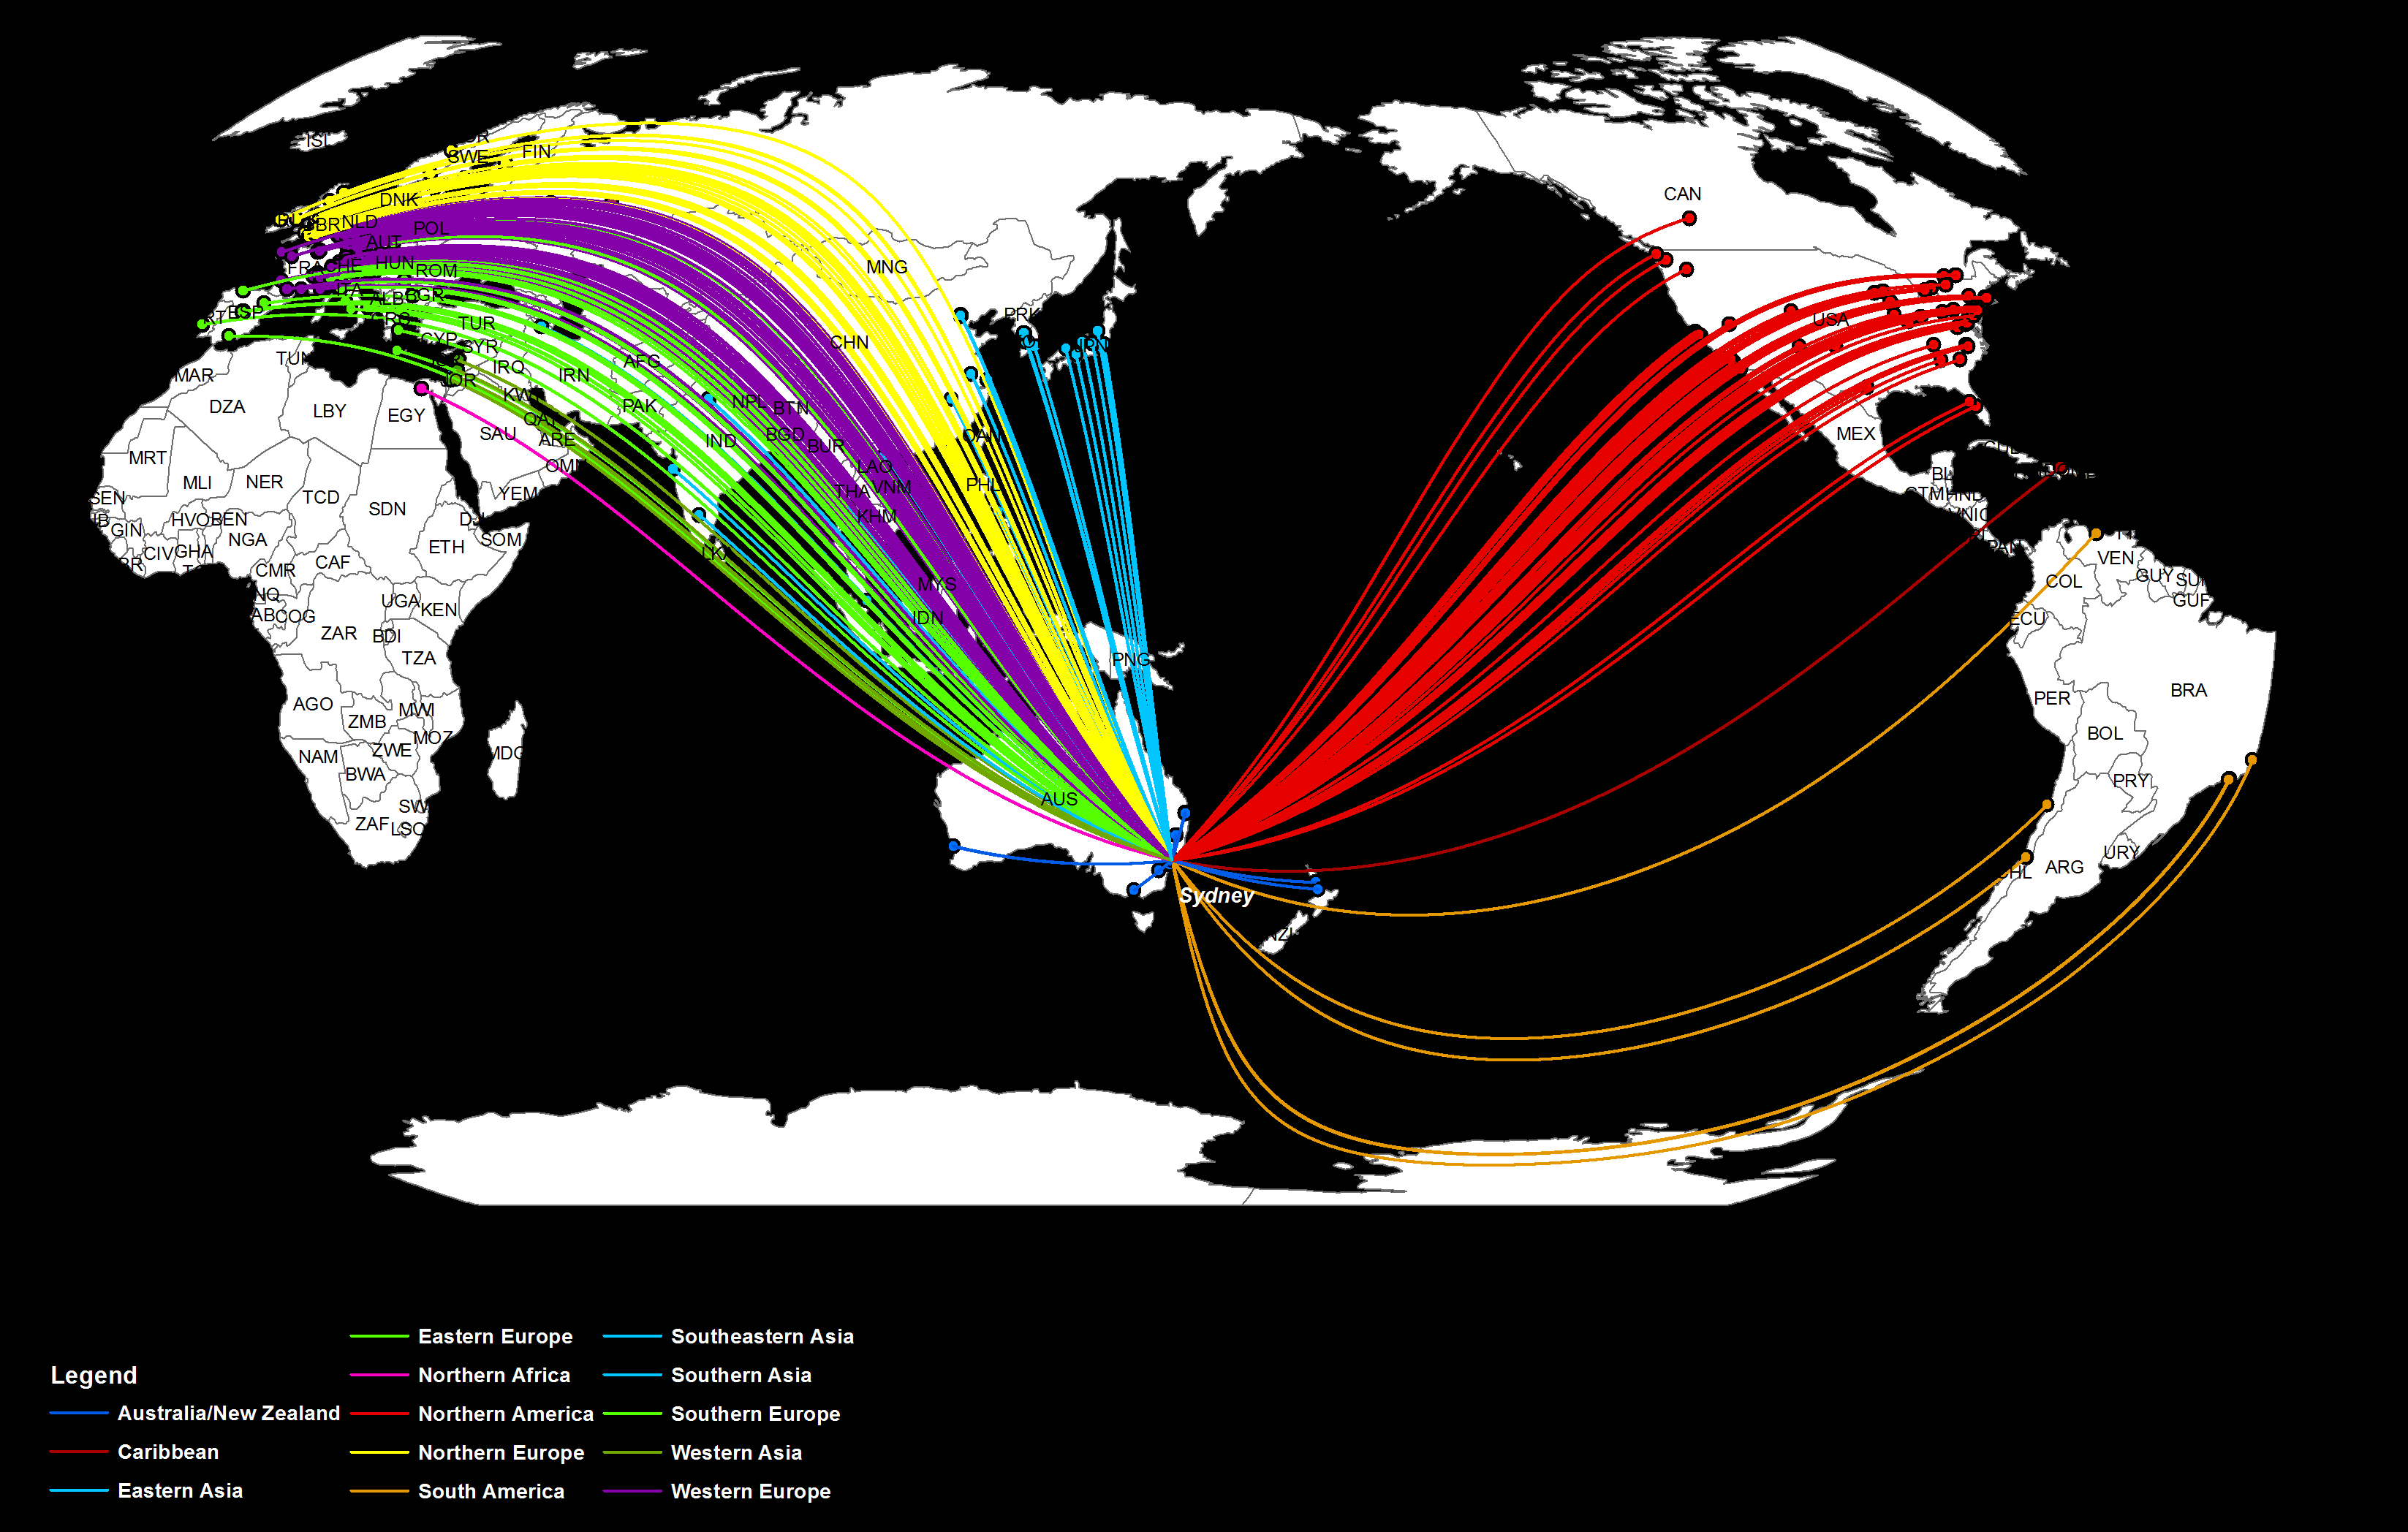
While the maps before were about individual researchers and their affiliations, the next figures are about the networks these researchers form. As a simple start, the figure below shows all the collaborations between authors at ISWC 2013.
Authors by Regions
To ease the interpretation, we also classified them by broader geo(political) regions.
People
Co-Authorship Networks
While the next figures are still spatial, they are not platial anymore. The first one shows an overview of co-authorships networks of authors (and their papers) at ISWC 2013. As you can see, there are several local clusters but they are not (densely) interconnected. Unfortunately, you will have trouble making any sense of this abstract figure; luckily you can click here for a high resolution version (11MB) with all the names and paper counts. This also includes workshop contributions.
.JPG)
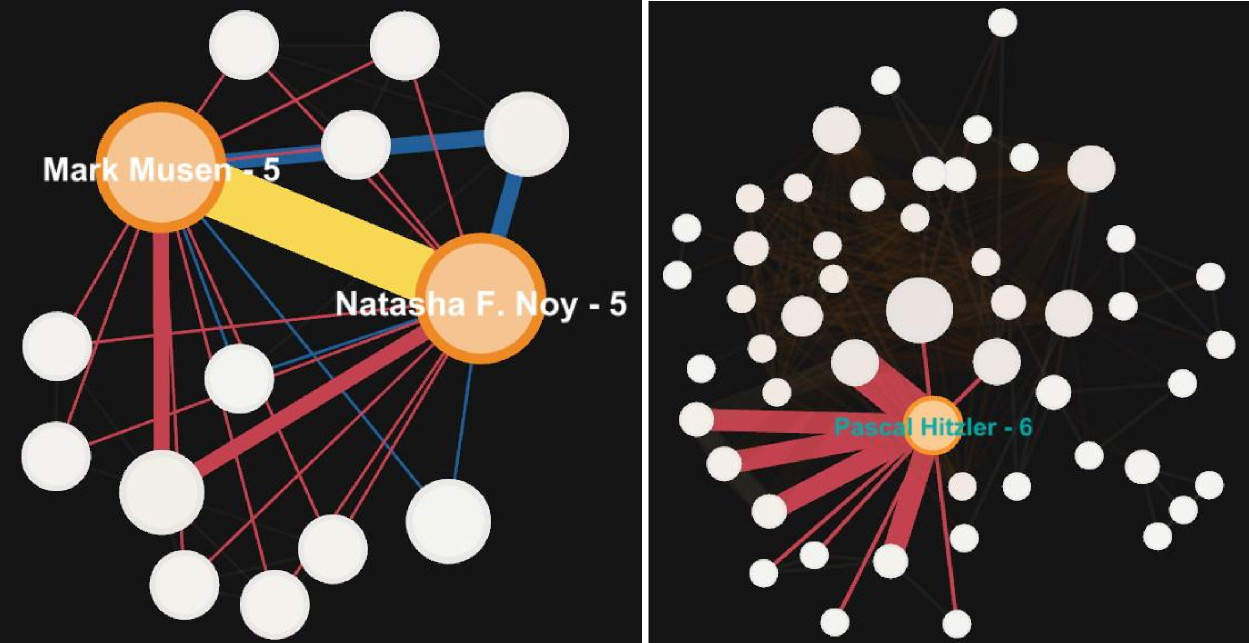
The next figure simply highlights central players of two of the aforementioned local networks just in case you want to get a first impression without navigating the huge file linked above on your own.
Topics
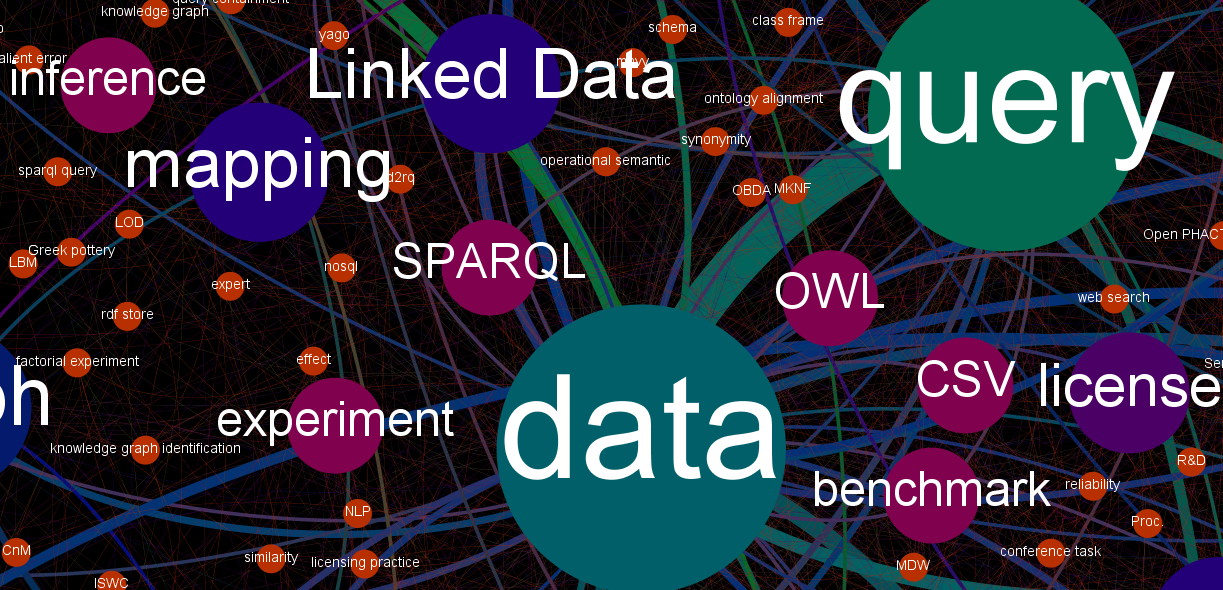
Key Phrase Network
You have probably seen figures like this many times before. We took all ISWC 2013 papers, extracted their full text, stemmed the texts, extracted key phrases using the Alchemy API, and rendered the phrases according to their importance and interconnections. The following figure shows a small fragment; you can access the full version (2.3 MB) here.
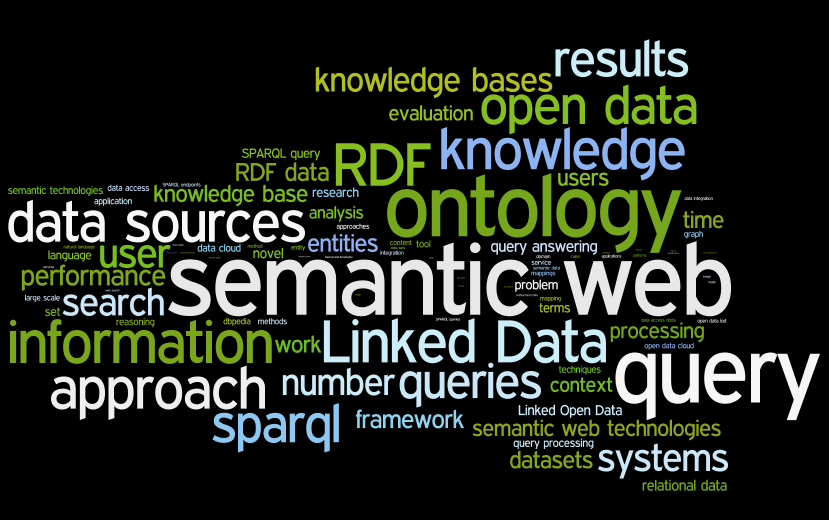
Word Cloud
You knew there would be a word cloud, didn't you? Personally, I still like them. This one uses the ISWC 2013 papers as data source.
Here at the Semantic Web journal, we expose all journal data as Linked Data and give you some interactive tools to explore these data. check our Linked Data-driven Semantically-enabled Journal Portal for Scientometrics.
(*) Amin, Bo, Grant, Jay, Song, Yingjie, and me.
- Krzysztof Janowicz's blog
- Log in or register to post comments
- 15994 reads